
Tuesday, September 13, 2011
Tuesday, August 23, 2011
Respect elliott wvae priciple.
Respect the channels..
Respect Fibonacci Ratios...Say Golden Ratio...
There r times when Wave principle itself clashes with short term wave counts
say most elliticans r saying break of 4800 without any bounce is likely but my view is different as i don't wbnt to consider short-term wavecounts in front of wave principle.
Tuesday, August 16, 2011

Friday, August 12, 2011

Thursday, August 11, 2011

Tuesday, August 9, 2011

Monday, August 8, 2011


Saturday, August 6, 2011
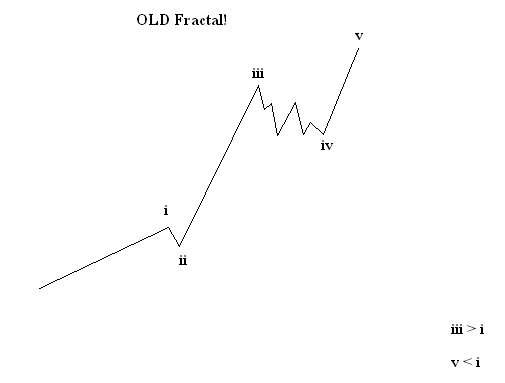
Last bet on old counts

Even after huge negatives, i want to place last bet on this count.
But this count is of no use if NIFTY closes below 5180.
Rest, wave 2 retraces wave 1 by 100+% + Wave 3 is the smallest in this count.
Everyone saying BEAR so if u want to sell (create shorts) then try to hedge ur positions by taking call options in ur portfolio.
Trend!
NIFTY: BULL!
Dow jones: BEAR!
Note: Investment in equities includes RISK of LOSS of INVESTMENT.
Friday, August 5, 2011
Thursday, August 4, 2011
Termination in zigzag
Zigzag as wave 2 of WAVE 5 (AUGUST 4)!!!
Why the c wave was terminated/failed to move above wave A????
Target for wave C was above wave A but it failed & thus it was also not possible to sell @ high.
But the reason is within the wave structure. Yes! GOLDEN RATIO is the answer i.e.
wave A was too much stretched that there was no space for wave c to occur.

Wednesday, August 3, 2011

Tuesday, August 2, 2011
2 August 2011
Buy near 5450 with stop-loss of 5-10 points.... or one can reverse position below 5440


Monday, August 1, 2011


Rectangular Vs Trianguler Bull Flags
Rectangular flags r more bullish than triangular flags in terms of uptrend after the BULL FLAG Formation.

Prive Gaps act like magnets
Todays upmove (+ve opening) filled the old price gap while day dragging filled todays price gap.
Next move will depend on any movement above/below todays range which is created by gaps.


Sunday, July 31, 2011
If nifty falls (extension) then 5400 & 5300 is the target but consider this as last fall. Best is to buy above the channel instead trying buy @ lows. Note: Trend is friend, buy costly but with confidence.
Rest, this is last correction and any breakout above the channel must take nifty/sensex to new highs.
Film Release: Loot Lo INDIA
http://sunkey.co.in/2011/06/loot-lo-india-new-indian-movie-release/
Are u saying, I m proud to be an INDIAN?
Are u saying, I m proud to be an INDIAN?
US debt crisis and DLF, Bharti results to impact mkt this week
Dow Jones Industrial Average
DJIA UPDATE: Well! I don't track djia @ depth but i do track many elliott wave blogs so that i can update my counts or switch to alternate counts.
DJIA EW Count suggest that the view of RUNNING TRIANGLES is near complete & THE NEXT DIRECTION IS UPWARD WHICH IS LIKELY EQUIVALENT TO THE THRUST FORMED BY THE TRIANGLES. @ E of triangles, usually followed by a news event specially in case of bigger formations.
So, this suggest that GLOBAL TRADING ENV. is not going to bad for near term & we can expect good days in next few trading sessions.
=============================================================

Triangles!!!! What is the most likely thing of trinagles which can be used to get the point of action @ wave 4 or wave b of zigzag??? Ans: NEWS EVENT
Friday, July 29, 2011

Thursday, July 28, 2011
Wave fractal: 28 July

It seems that wave v is near its end due to break of the channel... Thus, overall downtrending move may not extend too much. But this move is below my expectation as 5460 was expected @ near 50% fibo retracement.
28 July 2011
Wave started retracing the channel & seems ending but its gud to wait & watch as time frame is not equivalent to a wave...
Wednesday, July 27, 2011
wave iv uptrending
Excellent wave iv, within the channel........It can't break the channel i.e. NO THROWover movement!
Intraday wave iii normal - 27 July 2011
Wave iii (down-trending) just touched the channel but it should not break the channel as its not the extension.
It seems wave iii is near complete but i was expecting a bit more from this wave as the target 5460 is far away from here.
Wave i extension
Seems wave i extension!
Target calculated through a = c...
Fibonacci, ratios can be used to calculate relative target

Tuesday, July 26, 2011

Nifty 26 July 2011 (BEAR Trap for MANGO PEOPLE!)
T.V. analyst was bullish yesterday & may be they r bearish today...
Downside is just the trailer, actual downside is pending! T1: 5500, T2: 5400.
The E wave of triangles was SHARP just like A wave of triangles & same is this downside (C WAVE) must not take more time than A of ZIGZAG so the expiry FAVOR BEARS.
Monday, July 25, 2011
Nifty update 25 july
If NIFTY moves up then its a sure buy, just bought PE @ morning & added one @ top 5699.05...
Confirmation of new downtrend trend is below 5650. So, Shorting below 5650 is still a good bet.
Lets see what happens tomorrow (RBI Credit Policy Releasing tomm.)

Saturday, July 23, 2011
Elliott Wave Short Term Counts for Nifty
Elliott Wave Short Term Counts for Nifty

Wave C can take 3-4 days i.e. Nifty can fall due to RBI Credit Policy (25Pts hike) and it seems last hike.
Refer the Targets shown in the chart. I m tracking nifty in depth frm feb 10 & i don't know why but i m quite sure about this happening. So, best of luck, if anything goes wrong then S-L is also given in the above chart.
(25 July 2011 - Monday)

Subscribe to:
Posts (Atom)