Tuesday, August 23, 2011


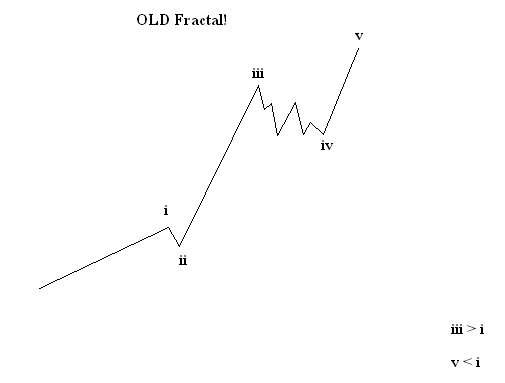
Respect elliott wvae priciple.
Respect the channels..
Respect Fibonacci Ratios...Say Golden Ratio...

I don't know why but i do prefer channels & trendlines more than Fibonacci...
There r times when Wave principle itself clashes with short term wave counts
say most elliticans r saying break of 4800 without any bounce is likely but my view is different as i don't wbnt to consider short-term wavecounts in front of wave principle.

Saturday, August 6, 2011

RSI = 16.78 (7day:M.A.)

Technical Bounce back to occur soon.

Last bet on old counts

Even after huge negatives, i want to place last bet on this count.
But this count is of no use if NIFTY closes below 5180.
Rest, wave 2 retraces wave 1 by 100+% + Wave 3 is the smallest in this count.


Everyone saying BEAR so if u want to sell (create shorts) then try to hedge ur positions by taking call options in ur portfolio.
Trend!
NIFTY: BULL!
Dow jones: BEAR!

Note: Investment in equities includes RISK of LOSS of INVESTMENT.


Thursday, August 4, 2011

Expect new bull run @ NIFTY/SENSEX

Termination in zigzag

Zigzag as wave 2 of  WAVE 5 (AUGUST 4)!!!
Why the c wave was terminated/failed to move above wave A????
Target for wave C was above wave A but it failed & thus it was also not possible to sell @ high.
But the reason is within the wave structure. Yes! GOLDEN RATIO is the answer i.e.
wave A was too much stretched that there was no space for wave c to occur.

Tuesday, August 2, 2011

61.8% Retracement for NIFTY is near complete!
5-3-3 Count for flat wave b is complete for nifty, any further downside means fail of counts

2 August 2011

Buy near 5450 with stop-loss of 5-10 points.... or one can reverse position below 5440
5-3-3 is a special format which occurs again & again. But such pattern is not mentioned in elliott rules as they say flat can occur as 3-3-5 (Regular, Running, Expanded/Irregular) & there are no variations of same.
FLAT Formation as wave b IN EFFECT which must not break 5450.........
Update! If nifty gets down below 5450 by even a cent then fail of bullish count....
Counts r flexible but not too much flexible.
Multiplier for c wave is 2.62 instead 1.62 to get the real bounce.
5460 should not break in case of bullish scenario....
Worst below 5460 is waiting
Wave iii is usually sharp so nifty can be in leading diagonals consolidtion pattern in case it holds or
extension of downward trend in case of further downside (fibonacci below 61-66%). & the pattern seems near complete.
Rest, overall outlook is not that bearish...

Monday, August 1, 2011

Just 10 times since the '80s has the Dow been up 1% in the opening half-hour and given it all, and more, back by 10:30 a.m. — as has happened today, as a triple-digit decline washes away an equal gain
Djia may drop upto 11,885 + 46 (Err in s/w) = 11931 but not more if view of triangles is there...

FTSE getting Higher

Bull Vs Bear

Old fractal

Rectangular Vs Trianguler Bull Flags

Rectangular flags r more bullish than triangular flags in terms of uptrend after the BULL FLAG Formation.
Jeffrey W. Kennedy frm ELLIOTT WAVE INTERNATIONAL!
@ HOW TO TRADE DIAGONAL TRIANGLES COURSE...

PRICE GAPS ACT LIKE MAGNETS!
His idea fits perfect in this pic!
Any movement above 5530 & 5550 seems Uptrend,
Between 5550 & 5480 is sideways &
Below 5480 is bearsish.

Prive Gaps act like magnets

Todays upmove (+ve opening) filled the old price gap while day dragging filled todays price gap.
Next move will depend on any movement above/below todays range which is created by gaps.

Trade Assistant: NEUTRAL

Support, Pivot & Resistance for 1 august 2011

S1     PIVOT   R1     R2
5451
5485
5517
5552

Bulls are back!

Source: Marketwatch.com
Seems some kind of unknown sideways pattern...... counts seems tough.
As Resistance becomes SUPPORT so 5500 is support....
Buy Activated!
Stop-Loss: 5500 - 5480 i.e. where nifty gets back within the downtrending channel.
SGX @ 5550!